RECENT POSTS
-
Pay Equity Disclosure is Just the Beginning
 06/06/2023
-
Why Performance Reviews Matter for Pay Equity
04/10/2023
-
Risk-Based Workforce Planning
06/17/2020
-
Understanding Today’s Talent Landscape to Drive Diversity and Inclusion
06/28/2019
-
Key Take-Aways from the Conference Board's 13th Annual Human Capital Analytics Conference
11/13/2018
-
How happy are you with your workforce analytics technology?
09/25/2018
-
The four pillars of analytics success for the HR business partner
08/08/2018
-
Is there room for more diversity on your workforce analytics team?
07/10/2018
-
How Unique Is Your Job Title?
03/27/2018
-
Going Where the Data Leads: Four Questions that You Need to Ask
01/09/2018
-
Workforce Analytics: Separating Hype from Substance
12/19/2017
-
Pacing Workforce Analytics to Win
11/28/2017
-
Selling Workforce Analytics: What's it Worth?
11/01/2017
Have you ever questioned whether you “fit in” at work? If you haven’t, you are more likely in a minority than the majority. Whatever your personal characteristics, background, experience or personality style, there are inevitably work situations where you feel that you stand out, and not always in a good way. These are moments of truth for feelings of inclusion or exclusion at work.
As people analytics experts, we not only analyze these issues, but we also live them within
our own organizations:
What we experience ...
Yet ...
We sit in a function—Human Resources (HR)—which is often dominated by
non-analytical skillsets
We are highly analytical (after all, analytics is in most of our job titles,
although there are many different titles out there … see our post on
the uniqueness of job titles)
We tend to be a small subset of the overall HR function, so we are a minority in
numbers
We are often expected to accomplish big things without the supporting
infrastructure to do so
We are seldom given the tools that we need to do our jobs and typically expected
to work with tools intended first/primarily for other purposes
Our work is typically significantly enabled by technology
We tend not to have clear career paths within our own organizations
It is often easier to find opportunities for growth outside of our organization
than inside
So, is it any wonder that we in the people analytics community may, on occasion, feel excluded or like we don’t belong?
Harnessing the power of people
analytics
Part of the challenge with measuring feelings of inclusion or exclusion is that the drivers of those perceptions may be, by their very nature, unique to us or at least smaller groups of us. In addition, both the drivers and outcome of exclusion indeed may be just that … feelings.
We’ve already talked in a prior blog post about the opportunities associated with measuring inclusion using subjective methods—similar to those developed to evaluate engagement (see our post on today's talent landscape). Here, we want to highlight some of the challenges and opportunities in quantitative measurement of this construct.
Quantitative measurement is possible but...
When talking about objective measures of inclusion, we more commonly see factors associated with:
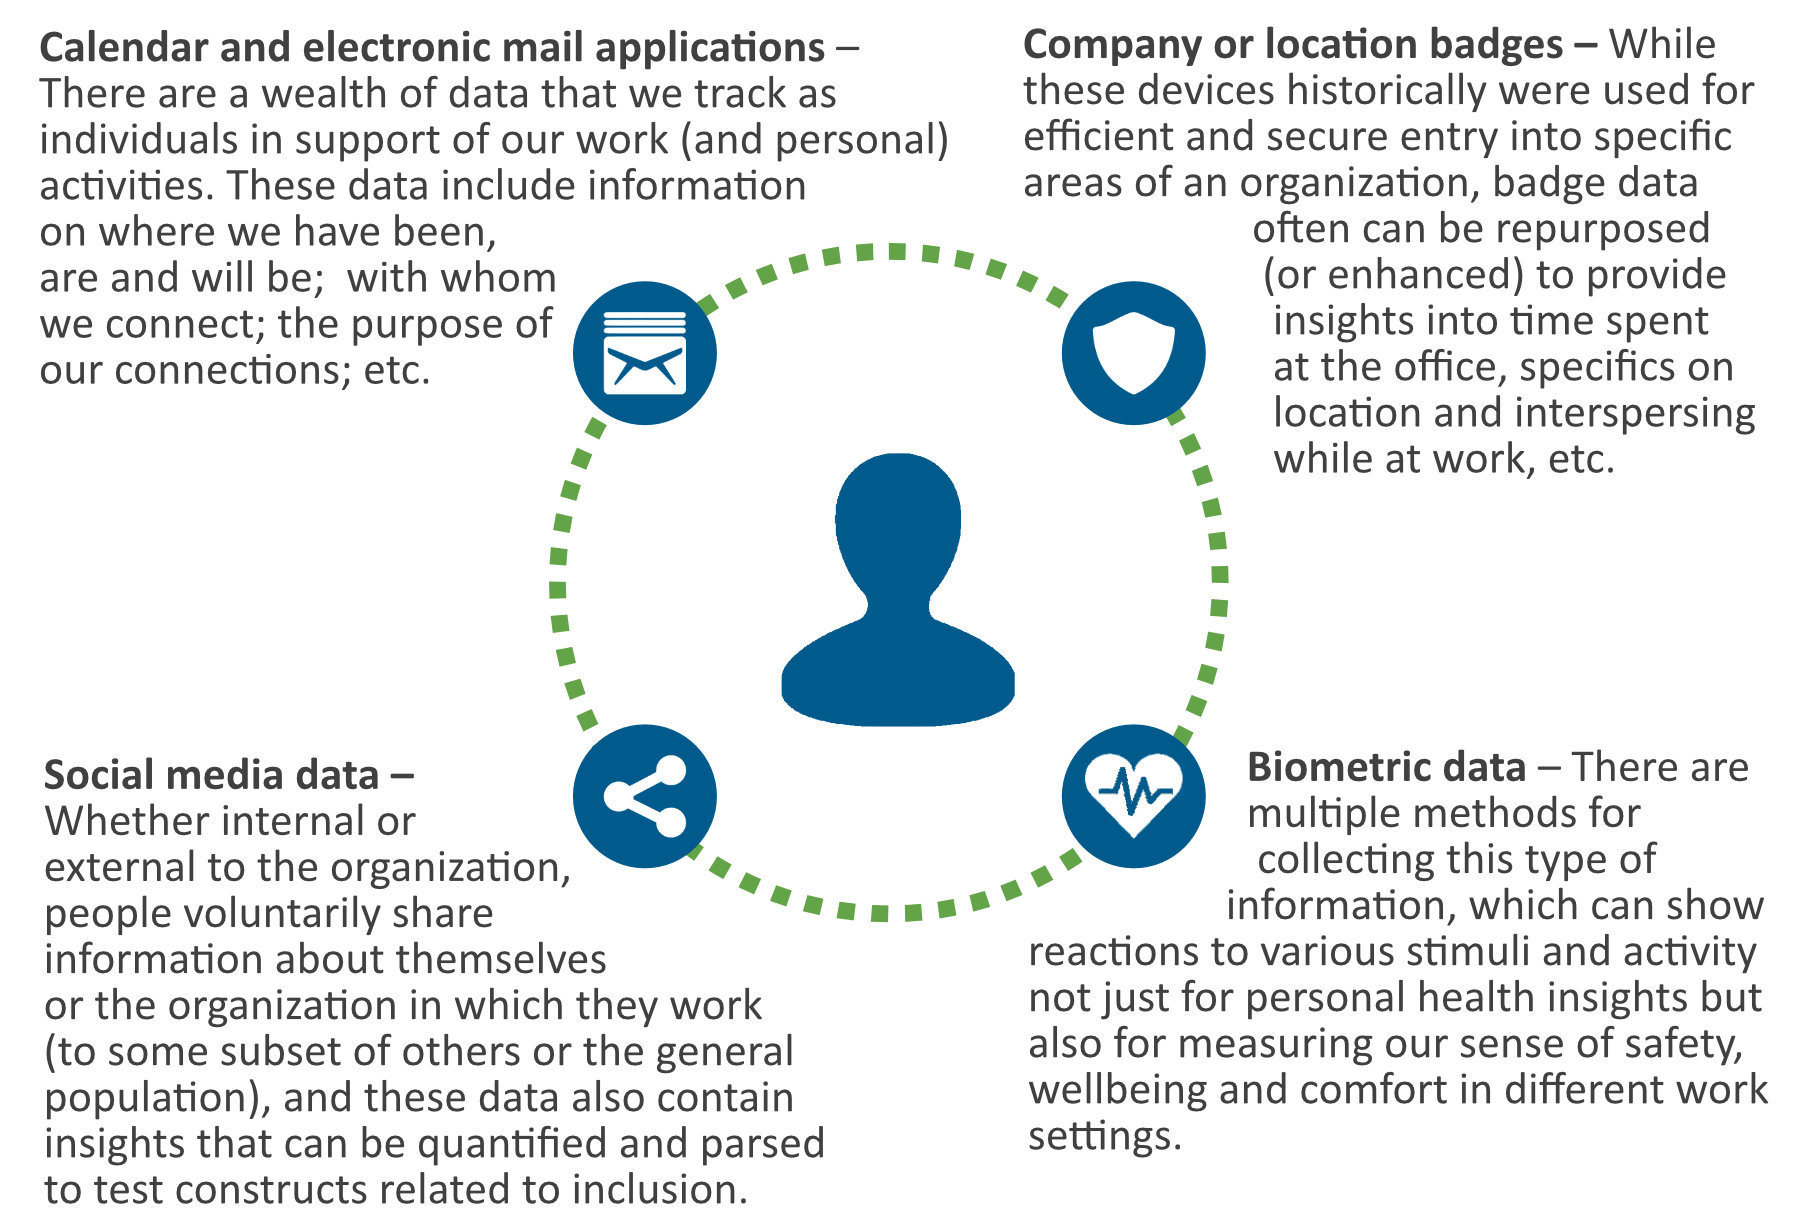
The benefits of examining interactions as an objective or quantitative measure of inclusion are, in part, that they are fundamentally more prevalent than employment dynamics as a whole, and there are several examples of data sources on which we could rely:
Now, the “but” ... while these measurements are all possible and, to varying degrees, reliable in examining potential levels of inclusion based on assorted forms of interaction, their measurement may, in fact, lead to less comfort at work when people are informed of this intended usage or to ethical questions if people are not informed of such intended usage. Between these concerns and the inherent questions related to the efficacy of the end result, organizations have been cautious in pursuing these types of analytics to date.
That said, the reality is that this type of data access and usage in other dimensions of people’s lives will become more commonplace in the corporate environment as well, so we as people analytics experts need to have an explicit strategy and protocols to address these categories of data proactively. In fact, the recently-announced United States Court of Appeals ruling for the Ninth Circuit in the case of hiQ Labs, Inc. v. LinkedIn Corp. upheld that automated scraping of publicly-accessible data, at a minimum, may be a legally-sanctioned tactic in the United States, whether or not organizations believe it is a virtuous one.
Commonality vs. anomaly detection
Another interesting consideration in research on inclusion relates to the distinction between examinations of drivers of a common outcome vs. those that are outliers or unique events. By its very nature:
Is inclusion about
the presence of factors that
make someone feel
a part of something...
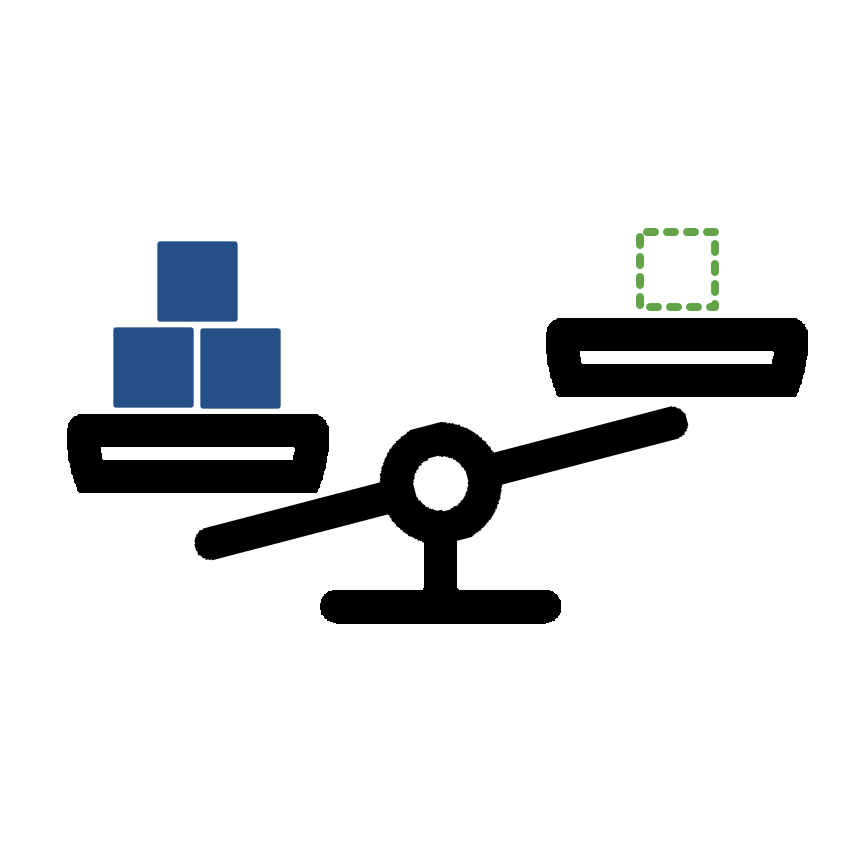
... or the absence of factors that consequently make someone feel apart from something?
If inclusion is negatively influenced, at least in part, by those moments when one doesn’t feel that one’s voice is represented or heard, we may have to consider an analytic approach that focuses on outliers or anomalous data rather than commonality to the extent that those data can be harnessed in some way. In essence, the approach may require identification of “moments that matter” when individuals uniquely experience exclusion at work.
As a small, specialty women-owned business, we are particularly invested in this topic and wanted to share some of the challenges and opportunities that we consider in order to make meaningful progress. With these thoughts in mind, go forth and analyze!