RECENT POSTS
-
Pay Equity Disclosure is Just the Beginning
 06/06/2023
-
Why Performance Reviews Matter for Pay Equity
04/10/2023
-
Risk-Based Workforce Planning
06/17/2020
-
How do we really know who feels excluded at work?
09/30/2019
-
Understanding Today’s Talent Landscape to Drive Diversity and Inclusion
06/28/2019
-
Key Take-Aways from the Conference Board's 13th Annual Human Capital Analytics Conference
11/13/2018
-
How happy are you with your workforce analytics technology?
09/25/2018
-
The four pillars of analytics success for the HR business partner
08/08/2018
-
Is there room for more diversity on your workforce analytics team?
07/10/2018
-
What's More Important: Performance Management or Workforce Planning?
02/27/2018
-
Going Where the Data Leads: Four Questions that You Need to Ask
01/09/2018
-
Workforce Analytics: Separating Hype from Substance
12/19/2017
-
Pacing Workforce Analytics to Win
11/28/2017
-
Selling Workforce Analytics: What's it Worth?
11/01/2017
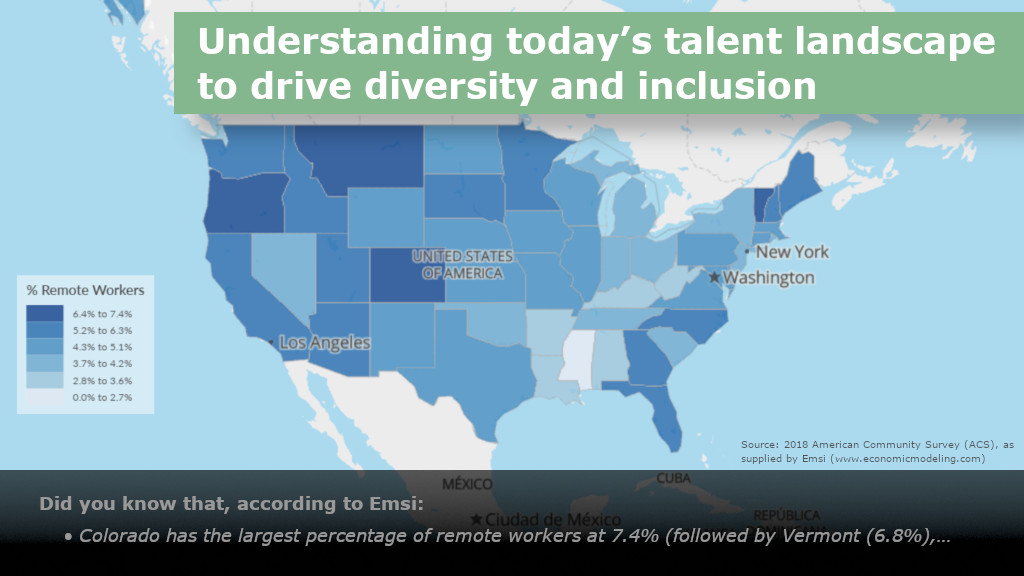
Did you know that, according to Emsi:
- Colorado has the largest percentage of remote workers at 7.4% (followed by Vermont (6.8%), Oregon (6.6%) and Montana (6.4%))
- Mississippi has the lowest percentage of remote workers at 2.1%
- The largest percentage of females in STEM occupations is in the Durham-Chapel Hill, NC, Metropolitan Statistical Area (MSA) at 32.6% (for MSAs with at least 10,000 STEM jobs)
With so many potential statistics available, it can be challenging for organizations to keep track of the myriads of available data to measure and drive diversity and inclusion (D&I). It is also equally, if not even more, challenging to make the case for actions supporting D&I efforts based on factors that still aren’t readily measurable.
This reality, along with the rightful concerns about data privacy, potential litigation and the like, shouldn’t limit our analytic focus on this topic. To the contrary, by breaking down D&I into its core components, we can establish and build an evolving approach that borrows from the principles of agile technology development—creating a versioning system for D&I analytics. Whatever your current “version”, you inevitably have the opportunity for improvement by considering more functionality for future iterations of your approach to D&I.
By breaking down D&I into its core components, we can establish and build an evolving approach that borrows from the principles of agile technology development—creating a versioning system for D&I analytics
D&I or I&D: Is that the question?
Some leaders have been known to debate whether revenue is more important than sales or sales is more important than revenue. In actuality, both are important, and it is less useful to spend our time debating the mechanics, timing, etc., instead of diving into what delivers the greatest combined outcome, recognizing that these factors are highly correlated—albeit with potential lag effects.
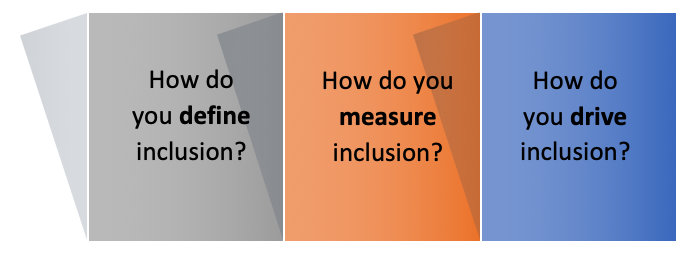
When thinking about D&I (or I&D), almost everyone agrees that D&I is valuable, but some organizational efforts are more successful than others. As with revenue and sales, there is minimal efficacy to the debate on whether diversity or inclusion comes “first”. Success isn’t guaranteed if you have language on, and even measures of, diversity and inclusion. It also isn’t enough to have a dedicated discipline within HR focused on the topic. Effective approaches to D&I have substantively different and more beneficial outcomes based on its core components, including:
Simple proxies aren’t enough
While there has been a lot of data-driven storytelling on diversity (focusing largely on representation and activity for a subset of measurable dimensions in the U.S. like gender, ethnicity and age), there have been less evidence-based insights on inclusion, and the quantity and quality of interactions. As such, we wanted to highlight inclusion-related analytics as an area for enhanced focus and functionality for continuous improvement.
Yes, there is talk about links between inclusion and engagement, and some even go so far as to use engagement as a proxy for inclusion. Others showcase their work in support of Employee Resource Groups (ERGs) as a hallmark of an inclusive organization. Certainly, both these measures are useful and may be indicative of—or even contribute to—more inclusive environments. That said, is there more to the story?
Recent attention and research focus on measuring the quantity of broad-based interactions, including how information is relayed within an organization and by and to whom.
Recent attention and research focus on measuring the quantity of broad-based interactions, including how information is relayed within an organization and by and to whom. Additionally, there is a smaller subsection of organizations that are endeavoring to evaluate the quality of interactions through some combination of factors—be it the associated positive or negative verbiage or overall influence in decision-making and the like.
The reality is that all these factors (and more) may well signal and contribute to an inclusive environment, and the opportunity is in quantitatively measuring the relative impact of each on the ultimate and somewhat illusive outcome of inclusion, which is itself an amalgamation of factors.
Taking a cue from engagement research
While we’ve stated that engagement isn’t a singular, sufficient proxy for inclusion, couldn’t we still follow a similar approach to the research of and methodology for defining engagement, which also typically is considered to be a blend of observed attitudes vs. a single factor? This question is quite interesting, as there has been a substantial amount of research dedicated to the topic of engagement and some certainly have been heading down this path.
There are early signals that suggest that the answer to this question could be “yes”, assuming we could both define variables that together sufficiently encompass the outcome of “inclusivity”, and we were likewise able to identify input variables or drivers that could be associated with this amalgamated outcome. As suggested earlier, the presence and vibrancy of ERGs then could represent a category of input variables for this analysis.
That said, much of the attention and measurement efforts to date have been on various input variables with an assumption that, “if we build it, they will come.” In other words, if enough of the input variables are present in sufficient quantities, then the output will be predestined.
The model of "all boats rising together"
While it should be true that the greater presence of input drivers leads to a greater outcome, we actually cannot prove the input drivers themselves without an actual outcome measure. We, as people analytics experts, need to be able to define and statistically measure the outcome in and of itself. To date, most attempts to do so have been largely qualified in nature or survey-driven, as with engagement, looking at views of organizational openness, influence on decision-making, “bringing one’s authentic self to work”, etc.
We want to leave you with a few questions:
We would be delighted to share what we’ve learned in our work and hear more about what you are doing within your organization. If you are interested in trading experience on this topic with us, please reach out to info@meritanalyticsgroup.com .